
iOS Debugging
Learn how to debug with Xcode and Safari using a simulator or physical device. Enable console logging, inspect network activity, and troubleshoot JavaScript errors effectively.
Xcode & Safari (Simulator)
-
Follow the steps in Build iOS from Source to build your iOS app.
-
Launch the app in the Xcode simulator (example: iPhone 17).
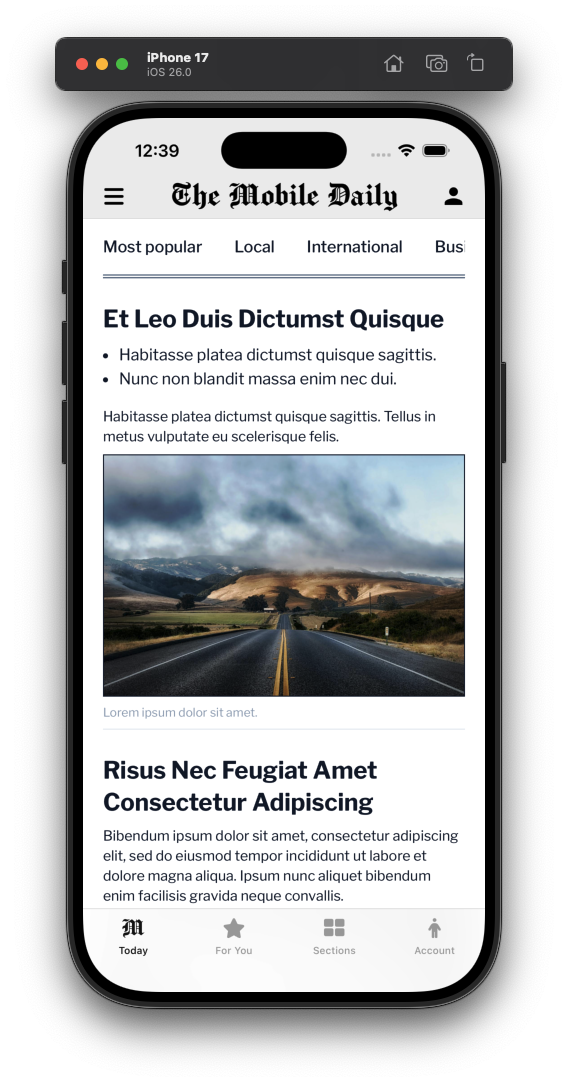
Xcode Simulator
-
Open Safari, then go to Develop > iPhone 17 (Simulator) > [Website Name] to open the Safari Developer Tools.
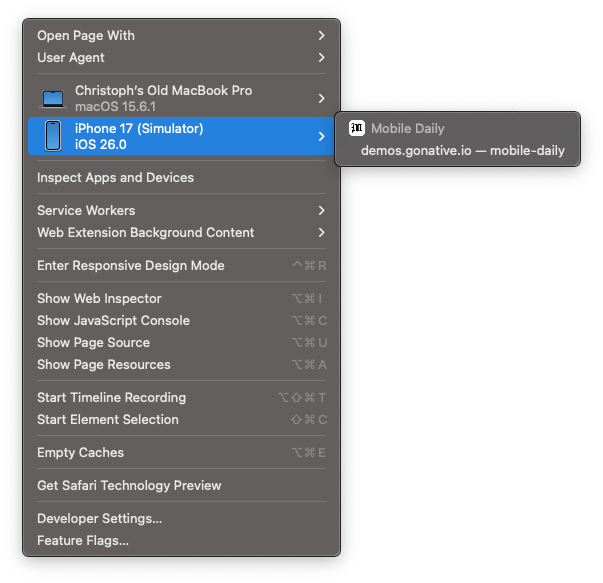
Safari - Develop
-
You can now use the Elements and Console panels to inspect and debug the website, with changes reflected in real time in the Xcode simulator.
Safari Remote Debugging (Physical Device)
-
Follow the steps in Build iOS from Source to build your iOS app in Xcode.
-
Trust the app on your device:
- Go to Settings > General
- Tap on VPN & Device Management
(on older iOS versions, this may be called Profiles or Profiles & Device Management) - Under the Developer App section, tap your email address or Team Name
- Tap the blue Trust "[Your Name/Email]" button
- Confirm by tapping Trust again in the popup
-
On your iOS device:
- Go to Settings > Safari > Advanced
- Toggle Web Inspector to On
-
On your Mac:
- Open Safari
- Go to Safari > Settings (or Preferences)
- Select the Advanced tab
- Check Show features for web developers (or "Show Develop menu")
-
Open your app on the device.
-
In Safari on your Mac:
- Click the Develop menu in the top bar
-
Hover over your device name and select your domain.
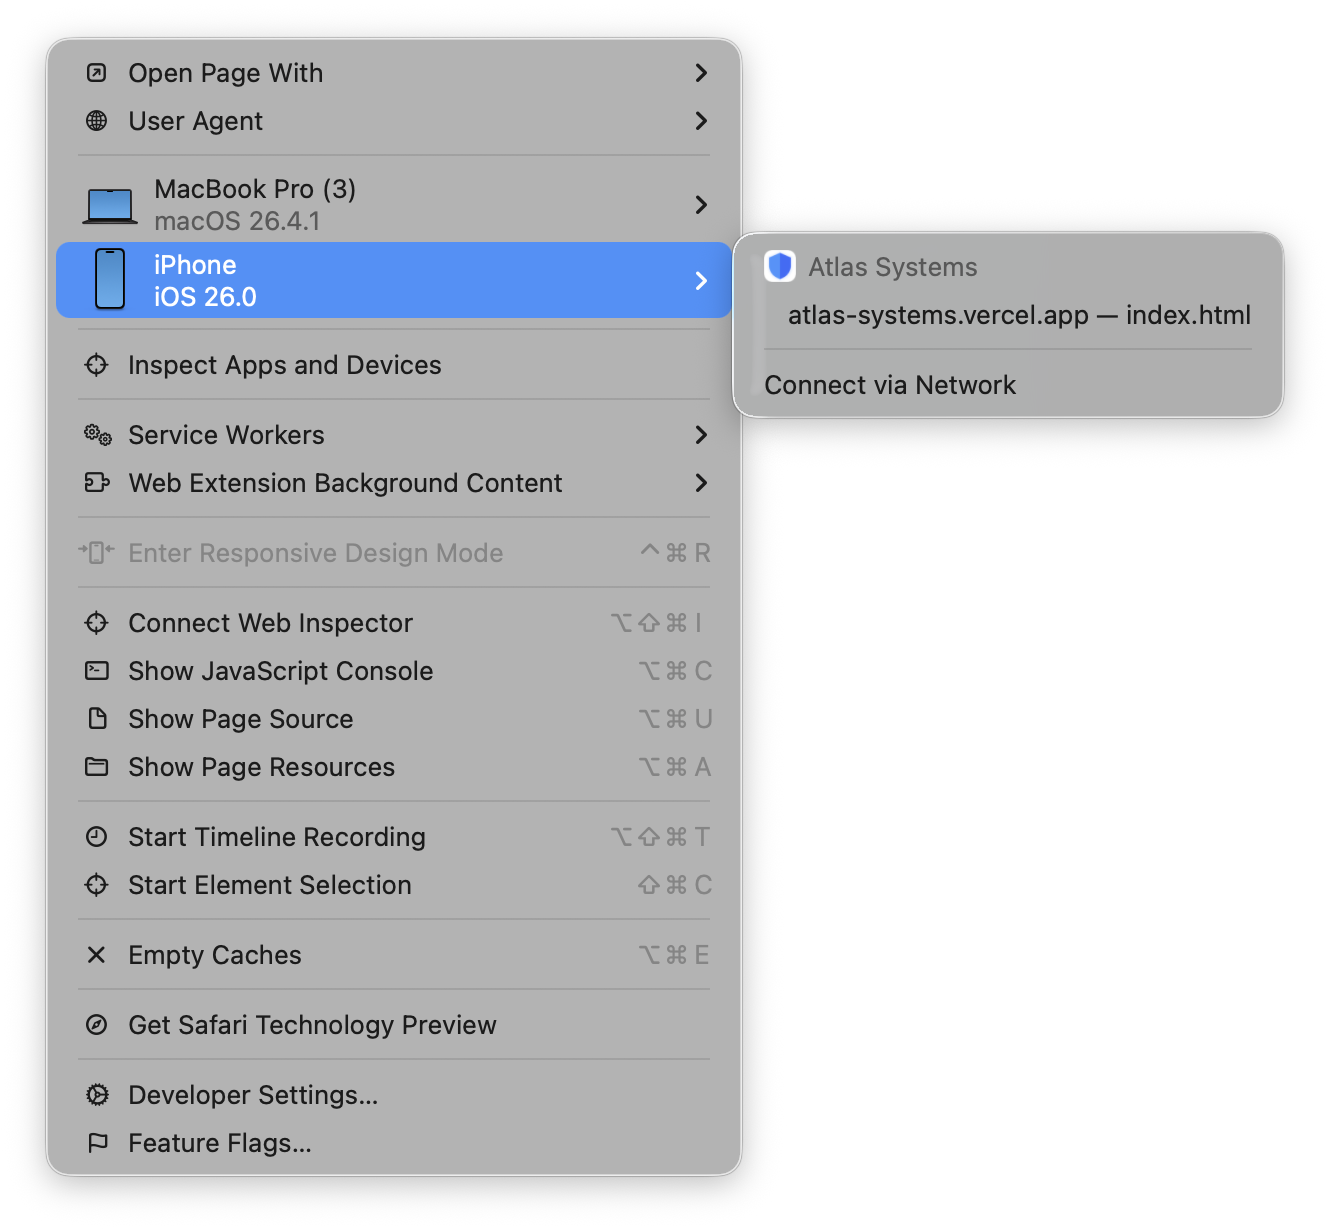
Safari- Develop
What You Can Do While Debugging
- Execute JavaScript commands or view errors and logs generated by your app
- Monitor API calls and resource loading in real-time
- Modify CSS and HTML on the fly to test UI changes
- Inspect cookies, LocalStorage, and IndexedDB data to verify sessions and caching