
Android Debugging
Learn how to debug with Android Studio and Chrome using a simulator or physical device. Enable console logging, inspect network activity, and troubleshoot JavaScript errors effectively.
Android Studio & Chrome (Simulator)
-
Follow the steps in Build Android from Source to build your Android app.
-
Launch the app in the Android Studio simulator.
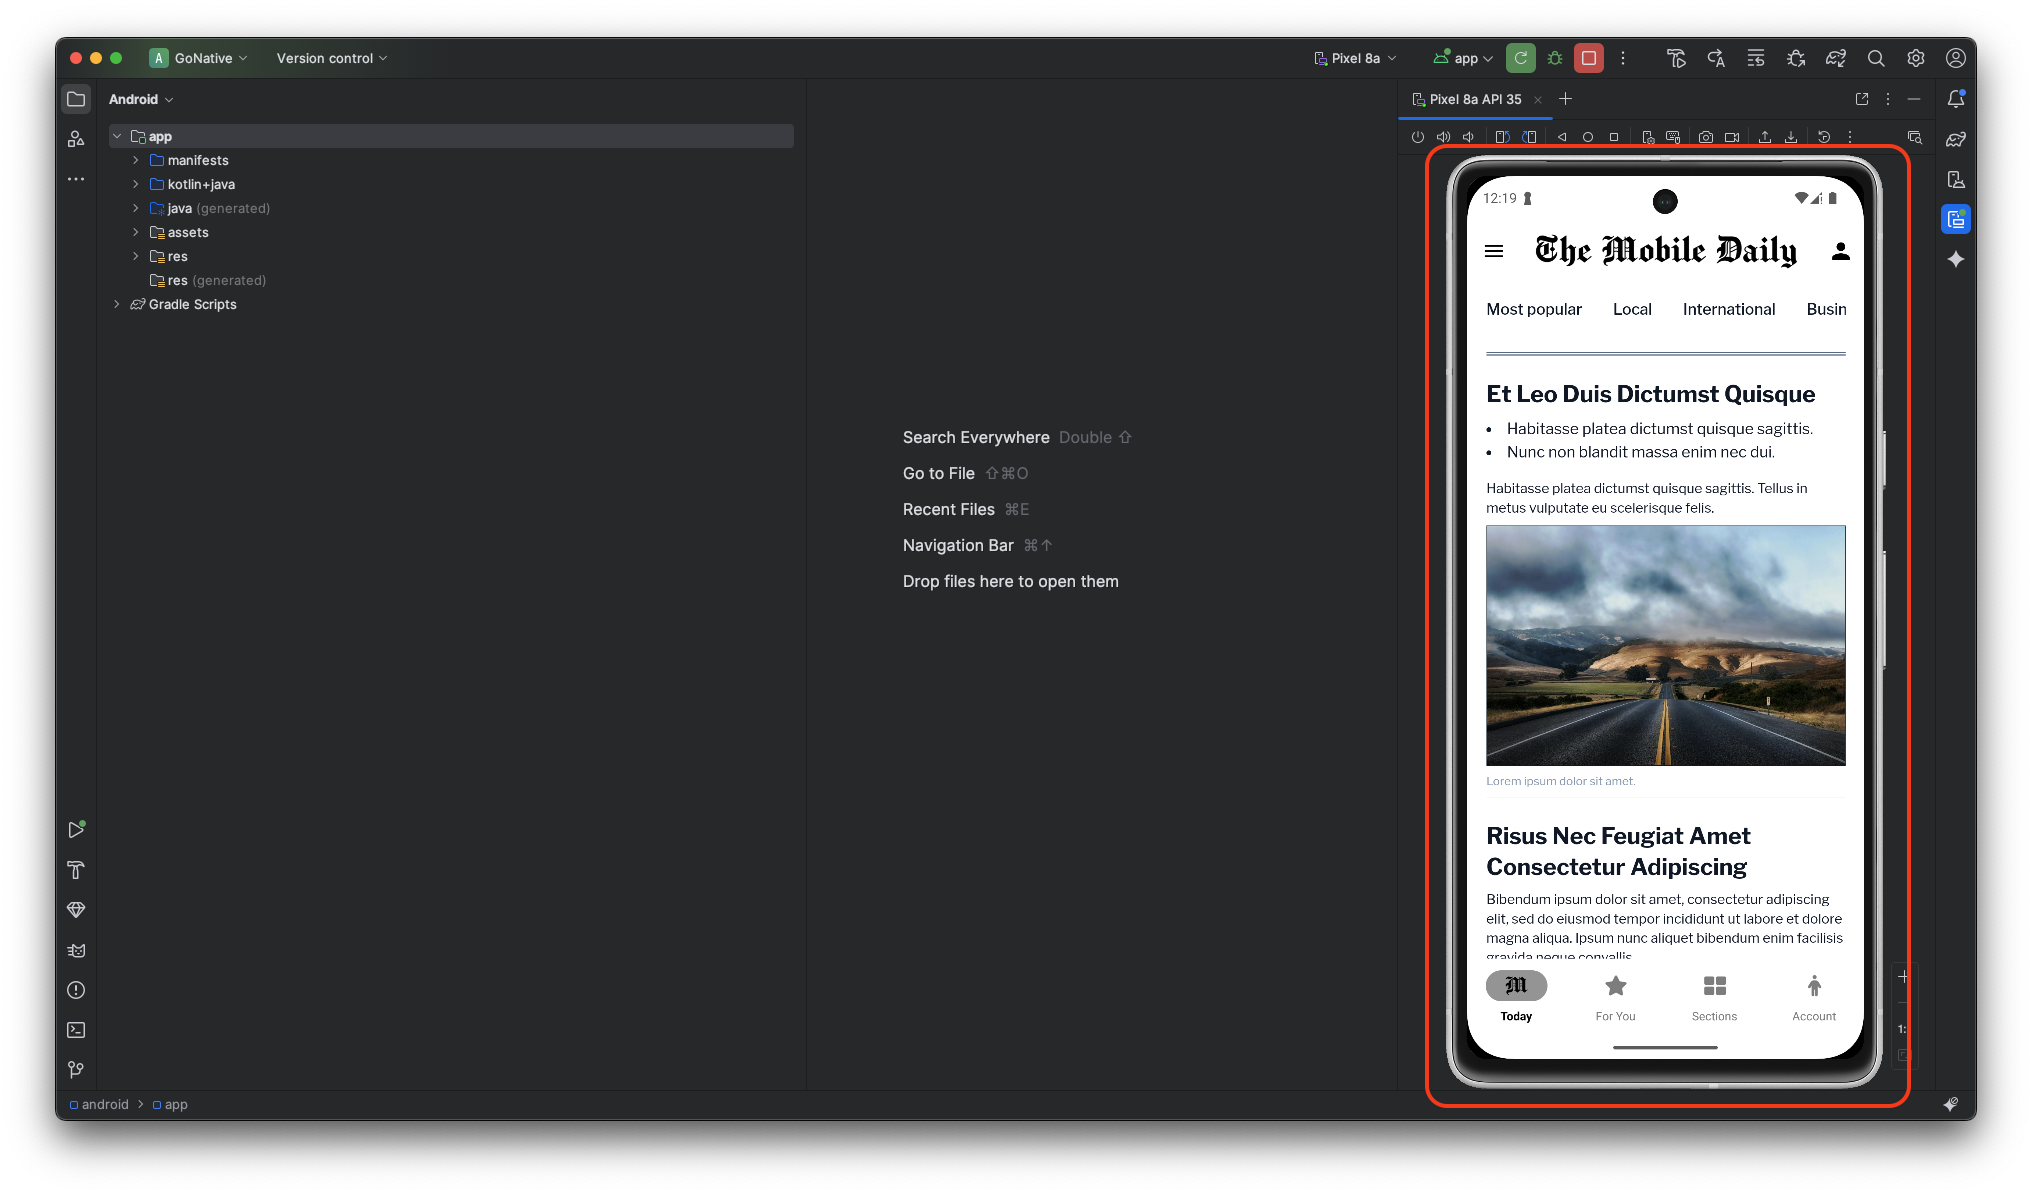
Android Studio - App Running in Simulator
-
Open Chrome and go to
chrome://inspect/#devices. Click Inspect to open Chrome Developer Tools for the website displayed in the simulator.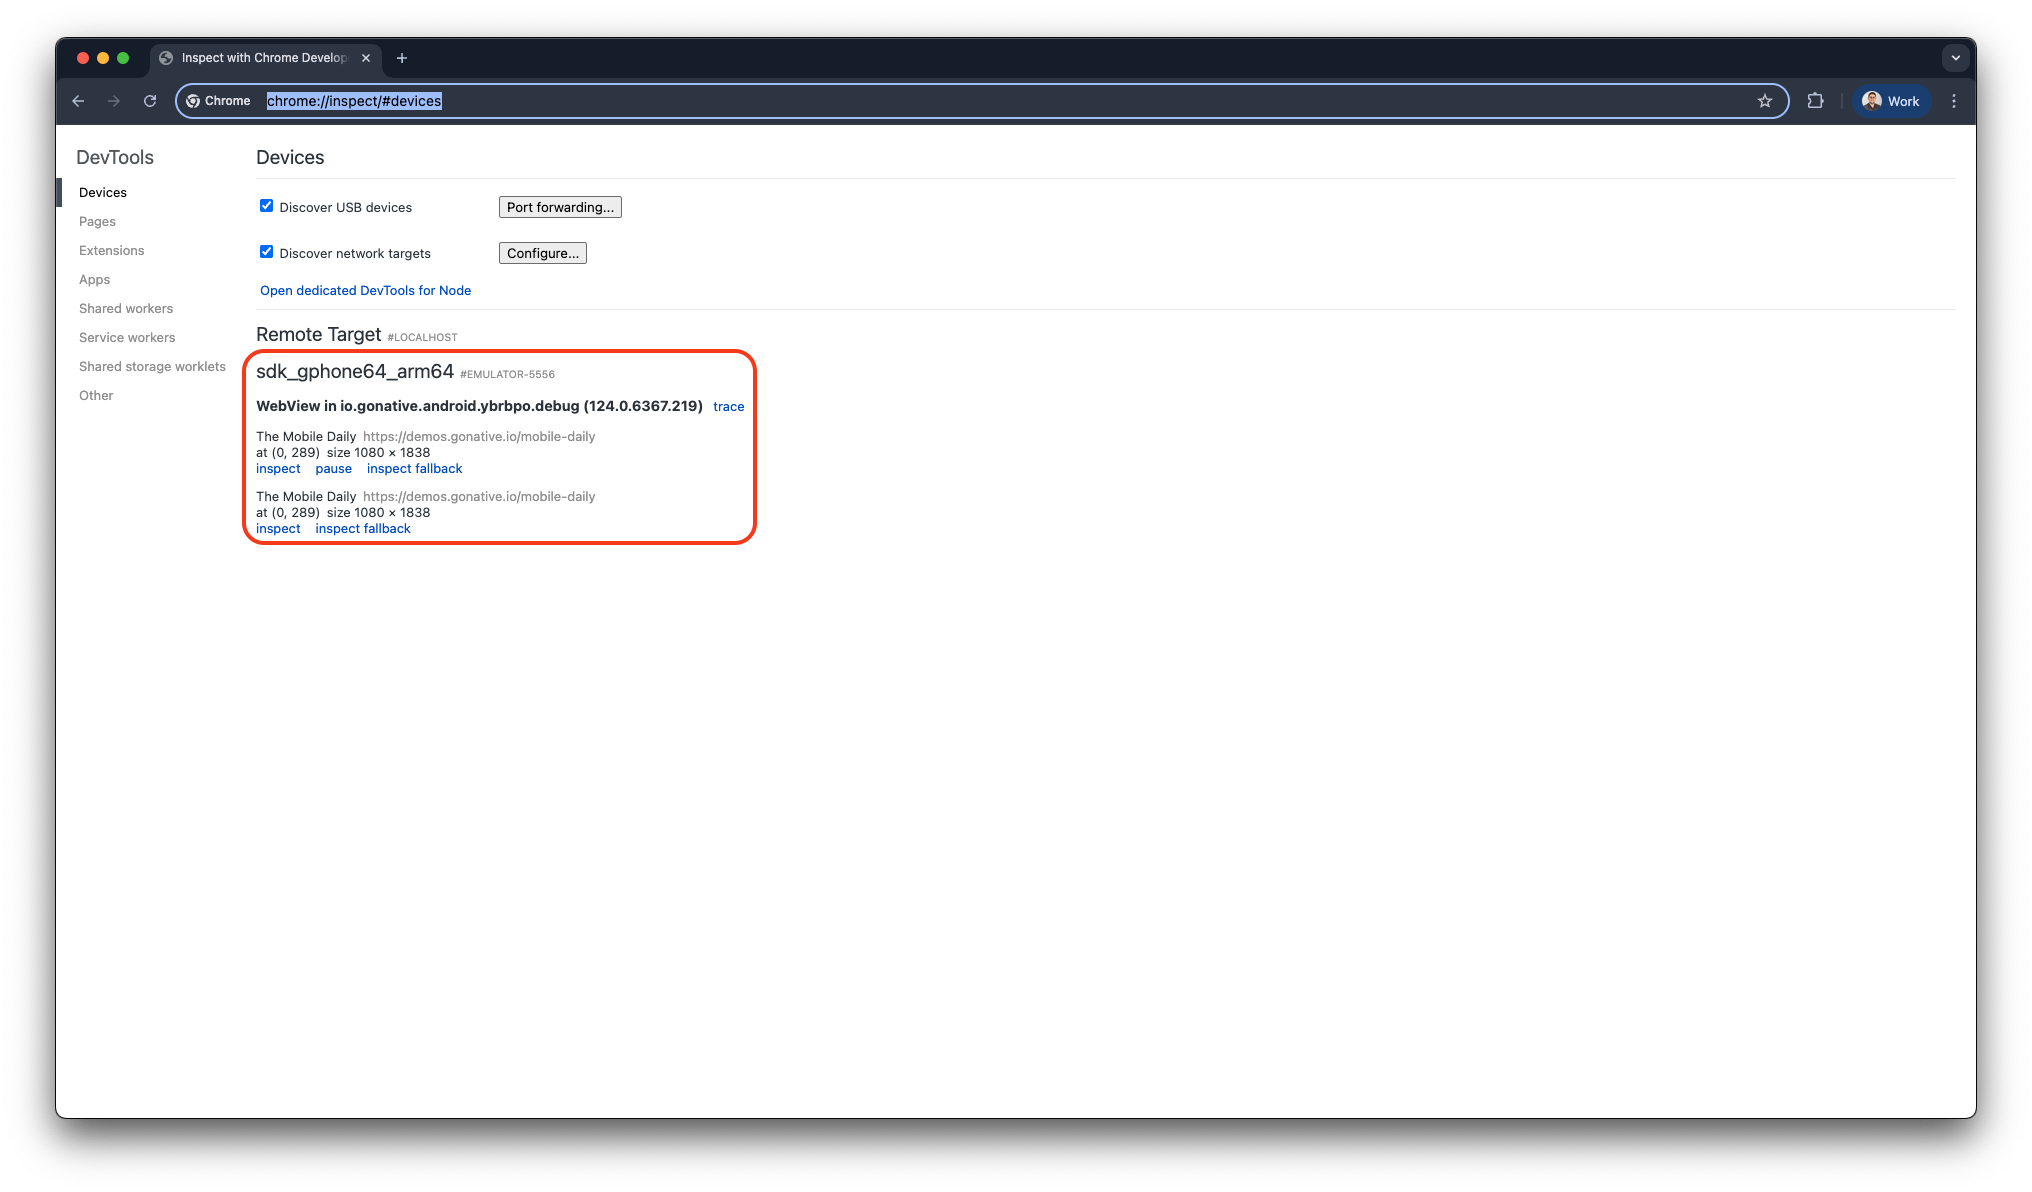
Google Chrome - Inspect with Chrome Development Tools
-
You can now use the Elements and Console panels to debug the website and view real-time updates in the Android Studio simulator.
Chrome Remote Debugging (Physical Device)
-
Follow the steps in Build Android from Source to build your Android app in Android Studio.
-
Enable Developer Options on your device:
- Go to Settings > About Phone
- Tap Build Number seven times until you see
"You are now a developer"
-
Go back to:
- Settings > System > Developer Options
(on some devices, this appears directly under Settings)
- Settings > System > Developer Options
-
Toggle Developer Options to On
-
Enable USB Debugging
-
Connect your device to your computer via a cable.
-
When prompted on your device:
- Tap Allow USB Debugging
- Check Always allow from this computer
-
On your computer:
- Open Chrome
- Navigate to
chrome://inspect
-
Under the Devices section:
- Your device should appear
- If not, confirm USB Debugging is enabled and try a different cable
-
Under your device:
- Locate your app
- Click Inspect
What You Can Do While Debugging
- Execute JavaScript commands or view errors and logs generated by your app
- Monitor API calls and resource loading in real-time
- Modify CSS and HTML on the fly to test UI changes
- Inspect cookies, LocalStorage, and IndexedDB data to verify sessions and caching