
Development Tools
Debug WebView logs easily with Appetize.io simulators
Accessing weblogs in a WebView-based mobile app presents unique challenges. Since WebViews function as embedded browsers within an app, they lack built-in developer tools, making it difficult to inspect network activity. Additionally, mobile environments impose restrictions on logging and debugging, further complicating the process.
To overcome these limitations, developers can inspect network logs using Appetize.io simulators by enabling debug logs and accessing the console output in the Appetize environment.
Developer DemoDisplay our demo page in your app to test during development https://median.dev/web-console-logs/
Enable Debug Logs
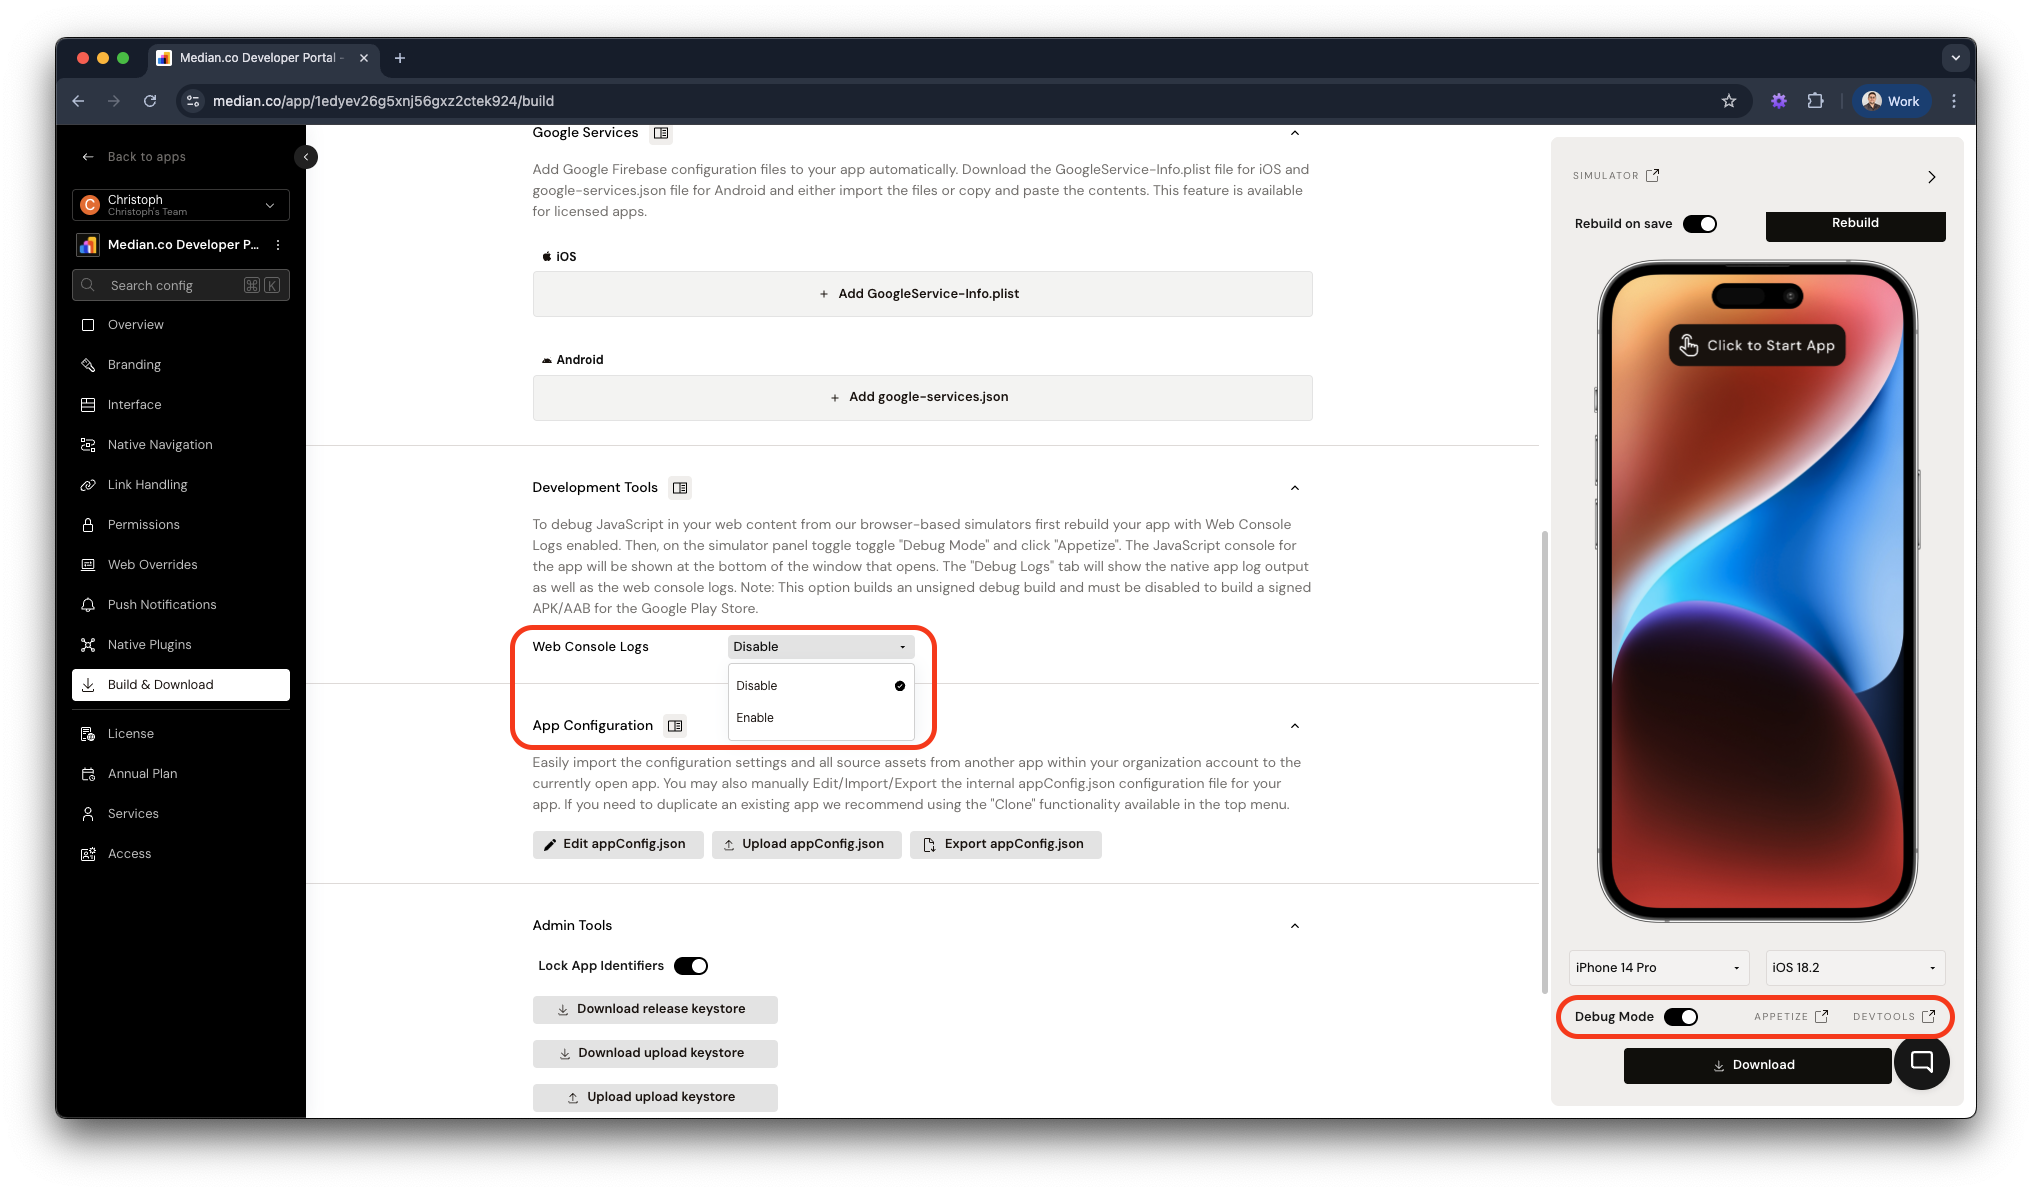
To debug JavaScript in WebView content using our browser-based simulators, follow these steps:
- Rebuild your app with Web Console Logs enabled.
- Open the simulator panel.
- Toggle Debug Mode and click Appetize to enable logging.
App Studio - Development Tools
Connecting Local Builds to a Browser
When debugging JavaScript functions, objects, or web console messages, you may want to use browser developer tools while running a locally built app. The following walkthroughs explain how developers can use Chrome and Safari with an active simulator to inspect the website’s structure, elements, and JavaScript output.
Android Studio & Chrome
-
Follow the steps in Build Android from Source to build your Android app.
-
Launch the app in the Android Studio simulator.
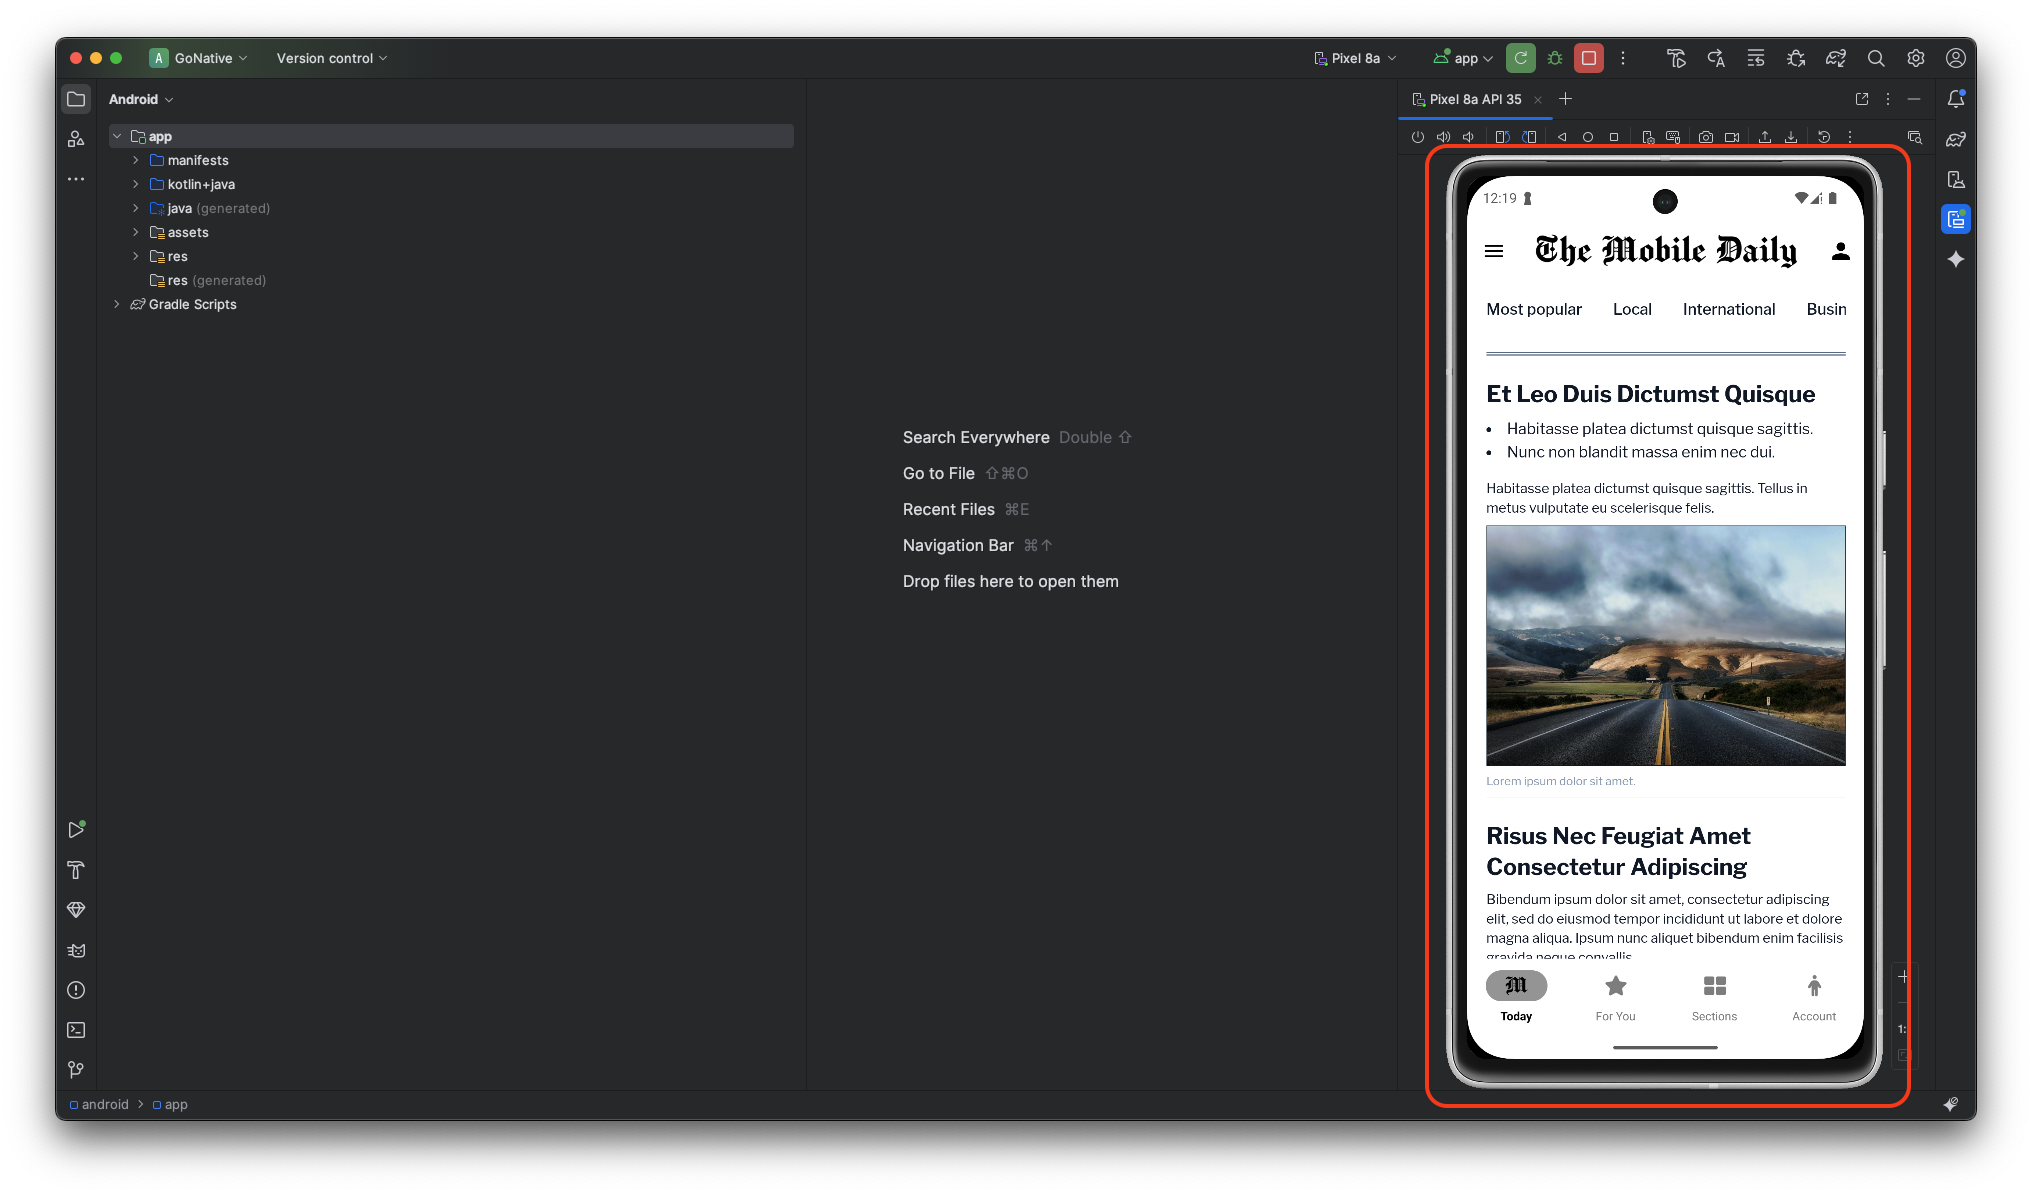
Android Studio - App Running in Simulator
-
Open Chrome and go to
chrome://inspect/#devices. Click Inspect to open Chrome Developer Tools for the website displayed in the simulator.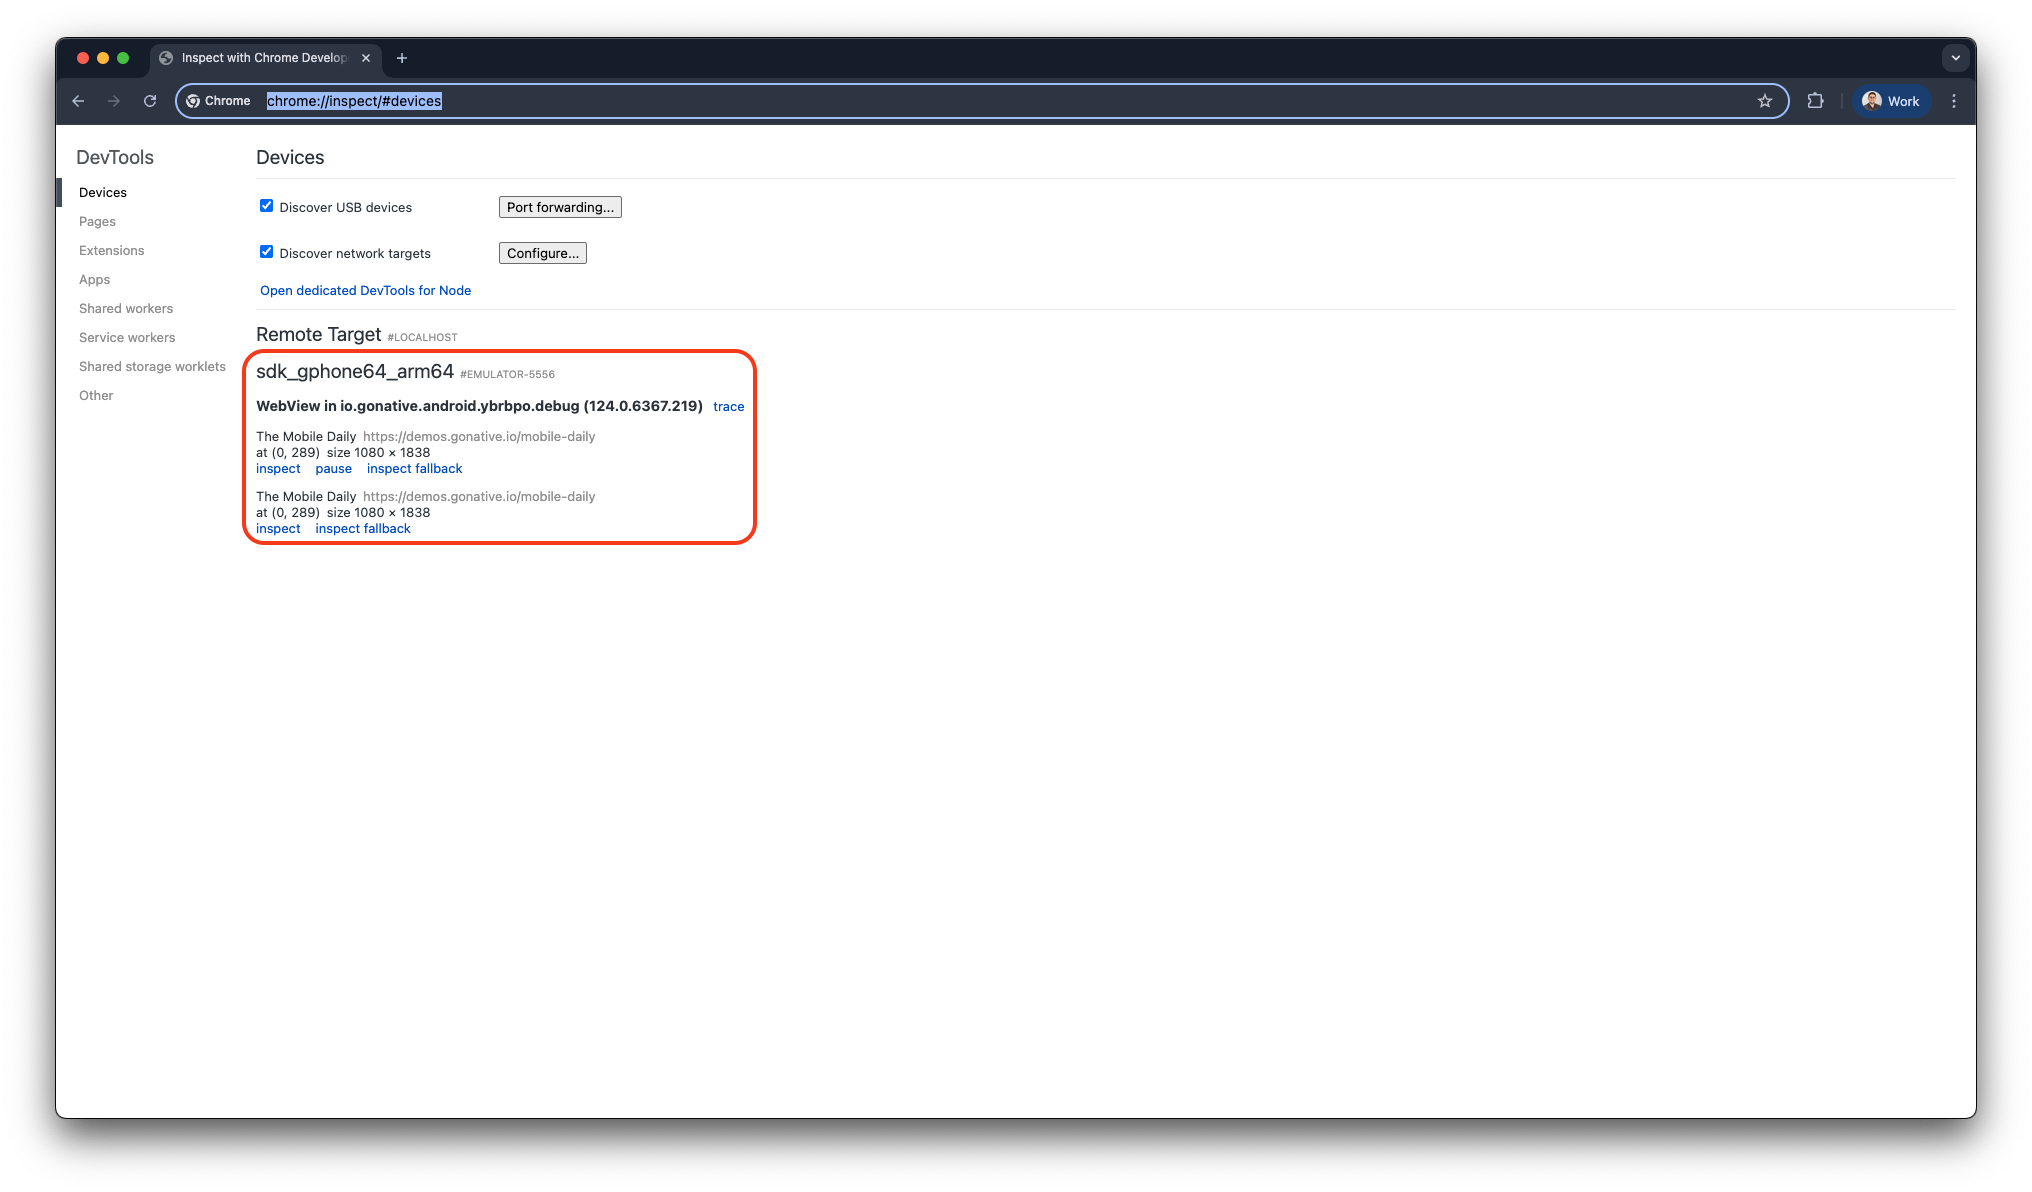
Google Chrome - Inspect with Chrome Development Tools
-
You can now use the Elements and Console panels to debug the website and view real-time updates in the Android Studio simulator.
Xcode & Safari
-
Follow the steps in Build iOS from Source to build your iOS app.
-
Launch the app in the Xcode simulator (example: iPhone 17).
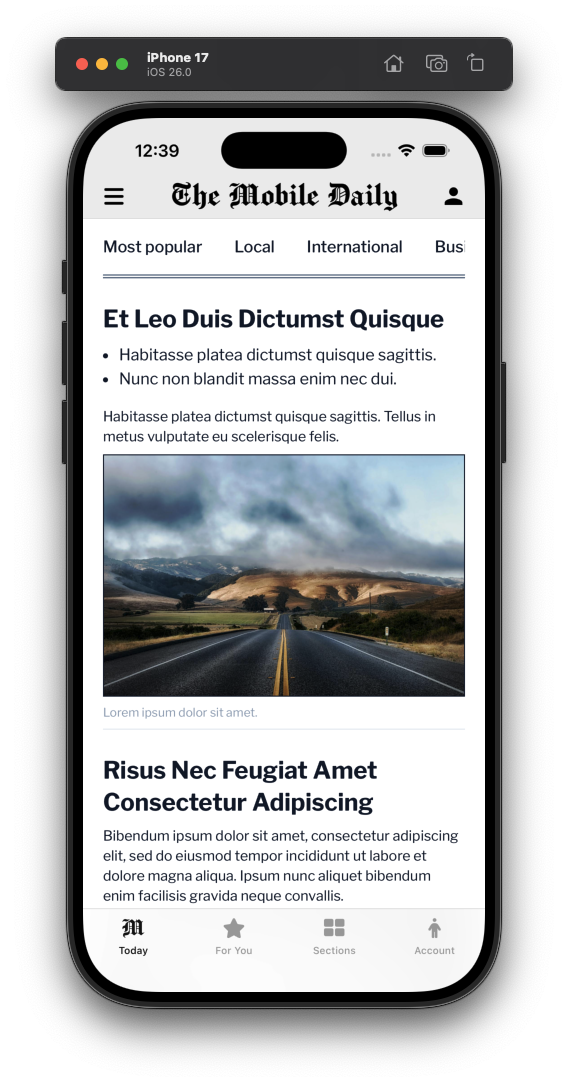
Xcode Simulator
-
Open Safari, then go to Develop > iPhone 17 (Simulator) > [Website Name] to open the Safari Developer Tools.
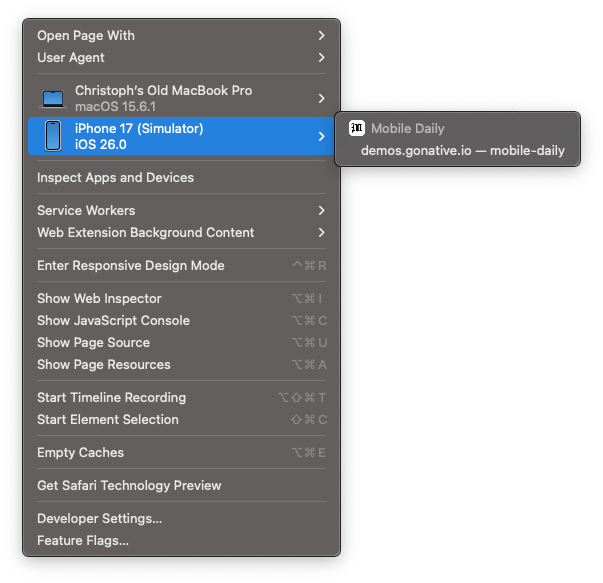
Safari - Develop
-
You can now use the Elements and Console panels to inspect and debug the website, with changes reflected in real time in the Xcode simulator.
Appetize
The Debug Logs tab in Appetize displays both native app logs and web console logs. This tool provides insights into network requests, JavaScript errors, and other debugging information. However, note the following:
- This feature requires an unsigned debug build and must be disabled before generating a signed APK/AAB for the Google Play Store.
- Console output includes
console.log(),console.warn(),console.error(), andconsole.debug(), each prefixed accordingly (e.g.,[console.log]or[console.debug]). - Native app logs will also be displayed, so filtering by prefix is recommended.
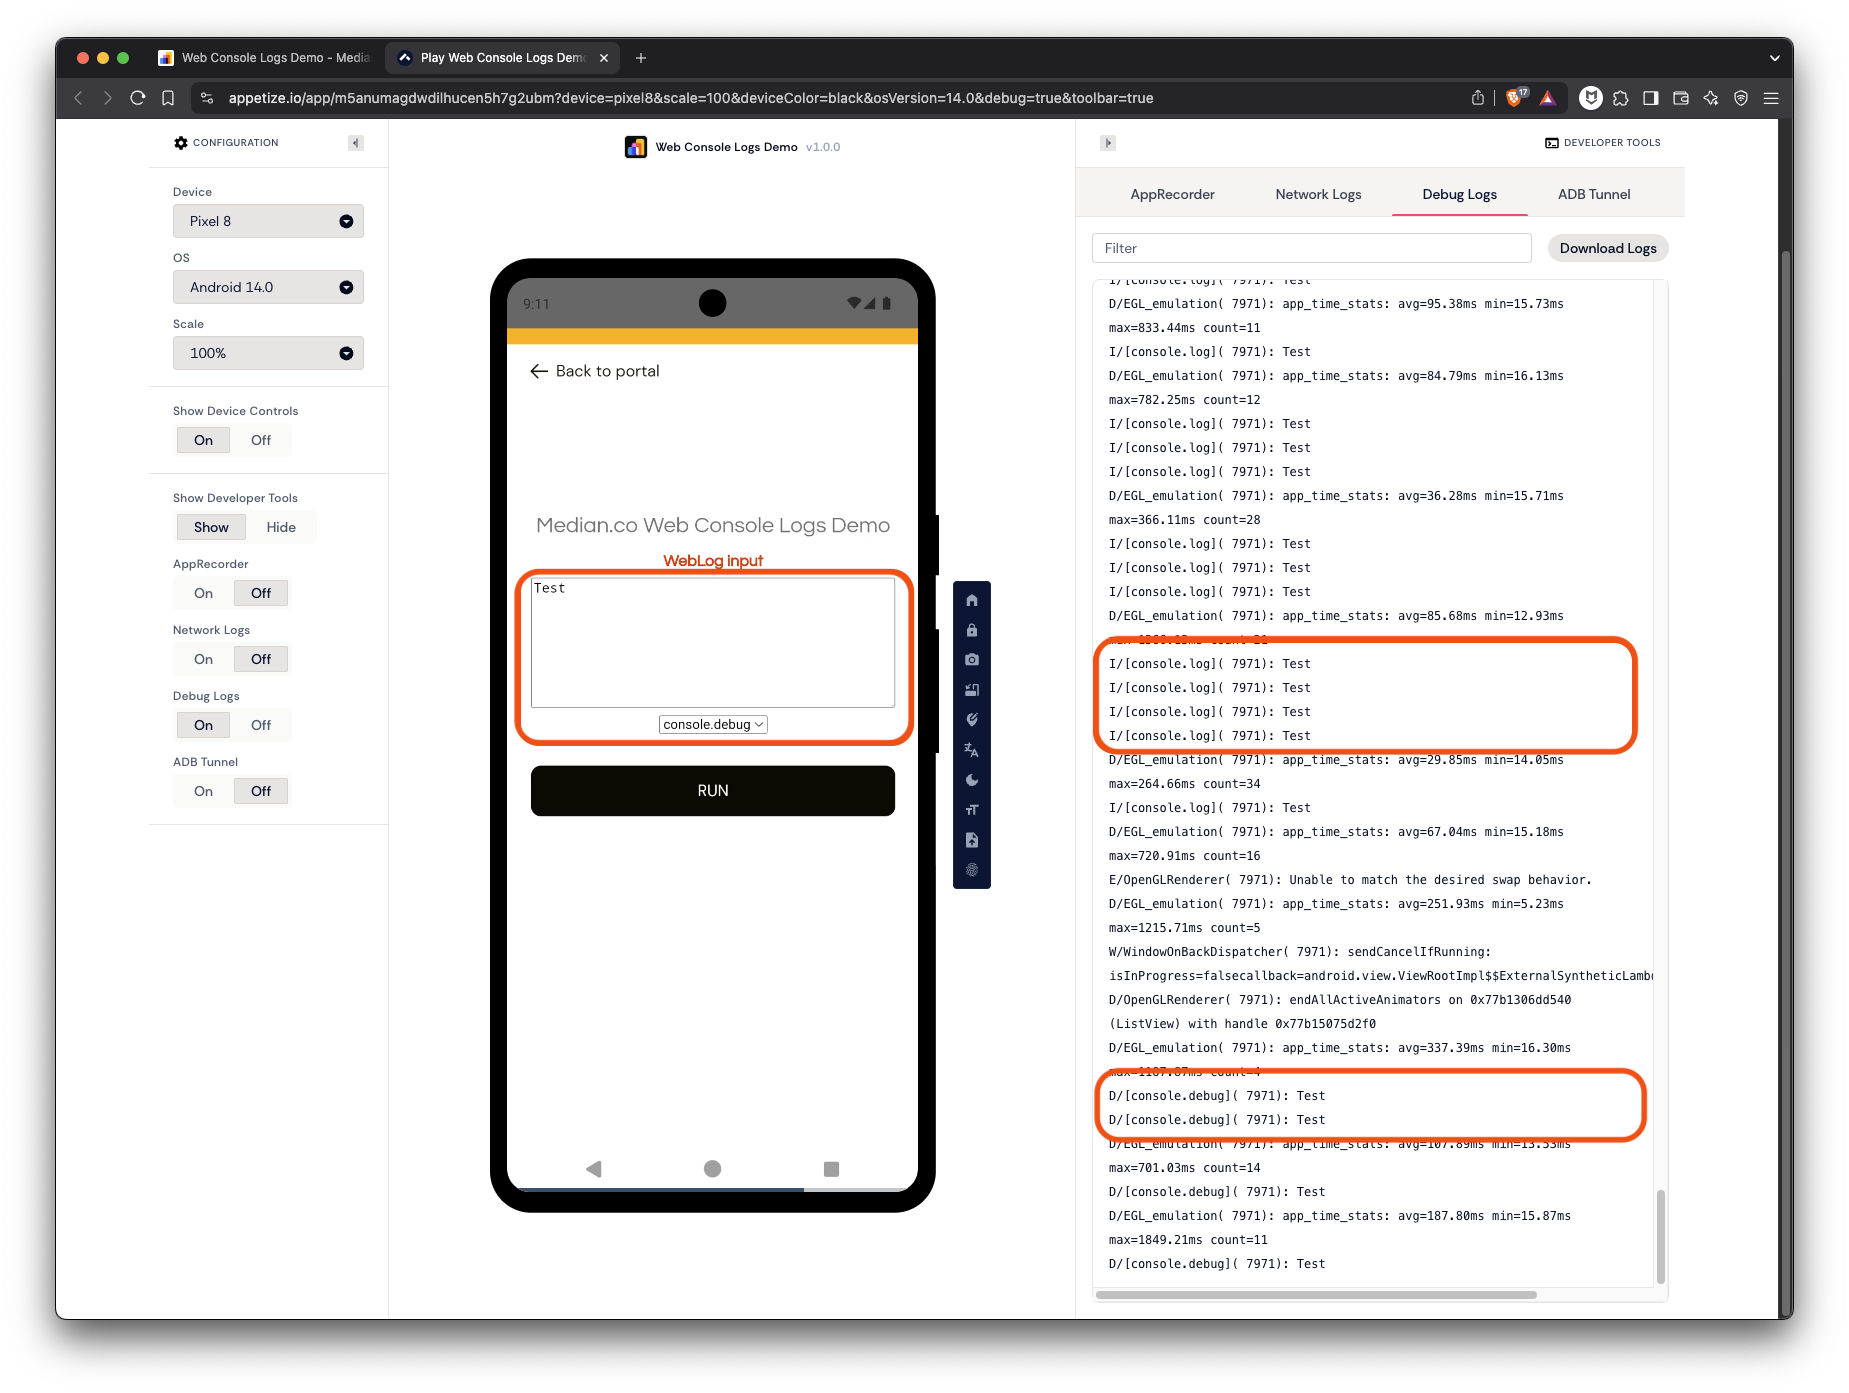
Viewing JavaScript console via Appetize
Frequently Asked Questions
Why am I receiving the 'Android App Bundle' error?
When Development Tools/Web Console Logs are enabled, the Median build platform generates an unsigned Android debug build (AAB). If you attempt to publish this AAB to Google Play, you will receive the error: The Android App Bundle was not signed. To resolve this, disable web console logs before generating a signed Android app.
Updated 7 months ago